ServiceNow

Overview

What is ServiceNow?

As a leading enterprise service management (ESM) tool, ServiceNow optimises processes and connects organisational silos with automated workflows. Through this unified, customisable platform, you can digitise every part of your business to work faster and smarter, leaving your teams to focus on meaningful, impactful work.

What is ServiceNow?

What We Do

Overview

Unifii's Service Overview

We empower our customers with ServiceNow expertise we yearned for when we were clients. Our services have been carefully crafted to tackle key challenges we have seen time and time again.

Unifii's Service Overview

Platform Management Services

With Unifii's Platform Management Service, your business can benefit from our brand new approach by choosing the level of intervention and assistance you need to make ServiceNow your best investment.

Advisory and Strategy

Our expert team helps you and your business align your technology with your strategic goals, and deliver the tools and processes needed to support you on your transformational journey.

Implementation Services

Combine deep technical capability & industry-wide expertise with a proven implementation methodology to ensure your ServiceNow instance fits your business.

Workload Management Application

The Workload Management App is a pre-built tool available on ServiceNow’s App Store, that revolutionises task management by replacing chaotic shared inboxes and spreadsheets with one streamlined platform equipped with data insights.

License Reseller Service

Our tailor-made licensing service sets us apart from the rest, simply because we want you to get the most from your investment. We'll do the hard work so you don't have to.

Portal Design Service

Create a seamless end-user experience for your customers and employees through your own bespoke and branded portal, tailored to what services your end-users need most.

ServiceNow Platform Assessment

Unifii's ServiceNow Health Check will help you identify issues, avoid common configuration errors, improve efficiencies and accelerate upgrades.

ServiceNow Applications

The Unifii team have created a brand new suite of ServiceNow applications to help your business use the platform more effectively and bring siloed teams together, all whilst improving transparency between departments.

Insights & Resources About Us Careers
Return to blogs

Reporting vs Performance Analytics: What's the Difference? FAQ Edition

Updated: 7th Nov, 2022
We’re rounding off our series discussing all things reporting and Performance Analytics with the FAQ edition. In this piece, we’ll be going through some of the key questions that we frequently get asked in relation to this topic, so that we hopefully finish the series with all of your main concerns addressed.

Parts one, two and three of the blog series are all linked respectively.

Can ServiceNow create my monthly review PowerPoint packs for me?

Dashboards can be created and exported to PDF, but typically we find that customers resort to copying screenshots of dashboards in their packs each month manually. Alternatively, they simply recreate visualisations of themselves offline based on the data that ServiceNow presents.

Some of our customers eliminate this requirement by providing self-service access to dashboards within ServiceNow and removing the offline element. However, we understand that for various reasons such as audit, legal and regulatory compliance, these types of packs are still to be required by many organisations.

Whilst ServiceNow reports and Performance Analytics are extremely powerful tools, your business intelligence strategy may extend to other third party tools - such as Tableau or Power BI - for needs such as these. Whilst we would encourage organisations to maximise on what can be achieved within the ServiceNow platform, there’s nothing wrong with extending to a third party tool as long as you have the team, resources and budget to support and maintain it. Such a solution will often involve ETL, data warehousing and maintaining the solution alongside future ServiceNow upgrades.

Can ServiceNow dashboards contextually drill down between different levels of a dimension or between dimensions?

Another ask we sometimes get is the possibility to view a dashboard that shows reports or Performance Analytics at a top level; service, for example, would then be able to click on a particular service and have the system automatically drill down across the entire dashboard to show the next level down (Configuration Item, perhaps). Unfortunately, ServiceNow dashboards do not currently have the functionality to enable drill downs to another dashboard and apply context in this way.

Can I have lots of filters on a responsive dashboard?

We’ve gone into a fair amount of detail behind this question in our previous blog, linked here. To summarise, though, reports added to dashboards can support multiple filters, but if you have a number of tabs, you may find yourself adding the same filters to each and having to select them on each one as you switch between tabs. For Performance Analytics widgets on a dashboard, you’re limited to just one breakdown filter being actively applied at any one time but you can add other breakdown filters that the user chooses to use instead.

However, if you're working with Next Experience dashboards you are able to add multiple concurrent filters that work with PA data. Whilst there's still a current maximum of two combinations, this remains a step up from what is available in responsive dashboards.

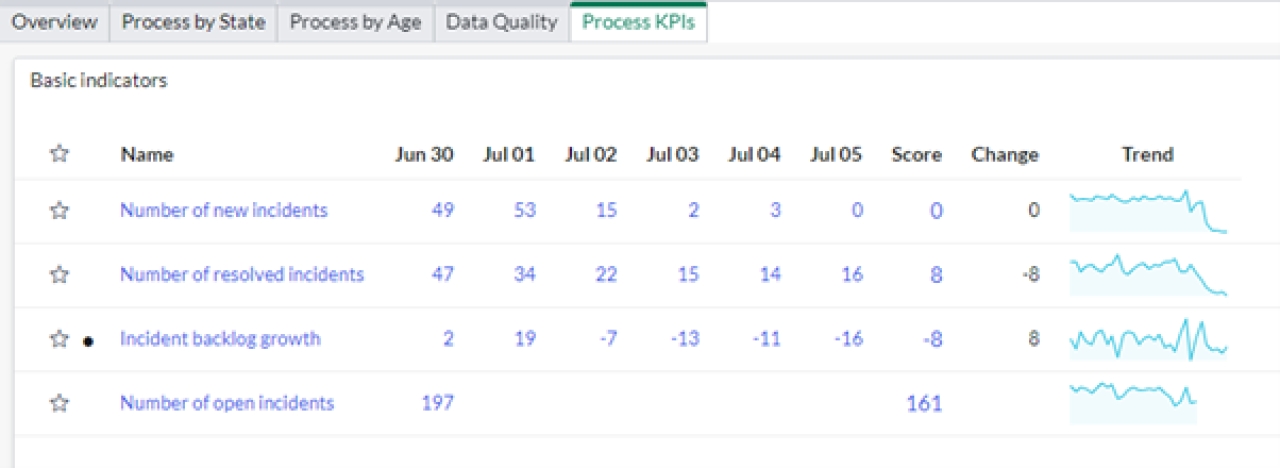
Can I quickly change my date ranges and aggregation periods?

Within Performance Analytics this is easy to achieve for a specific indicator within Analytics Hub. When looking at dashboards across multiple indicators, however, the functionality to change your time periods and aggregation dynamically becomes significantly reduced. Dashboards are typically designed to be focused on a specific period, from where you can then drill down to your results and carry out additional analysis through Analytics Hub, or utilise some of the interactive options that may be available on specific widget types.

Within reporting, date or customer interactive filters can be applied to dashboard tabs and these work great if your tab is entirely focused on a specific set of related metrics. These may include new incidents and new incidents by service, by priority etc. But when you're mixing metrics within a dashboard - such as new incidents, open incidents, closed incidents - the ability to use these filters can become detrimental. We recommend that dashboards (or tabs) are focused for different periods, and then to create reports with the pre-filtered date filters applied to them. Switching aggregation levels on a dashboard is not possible.

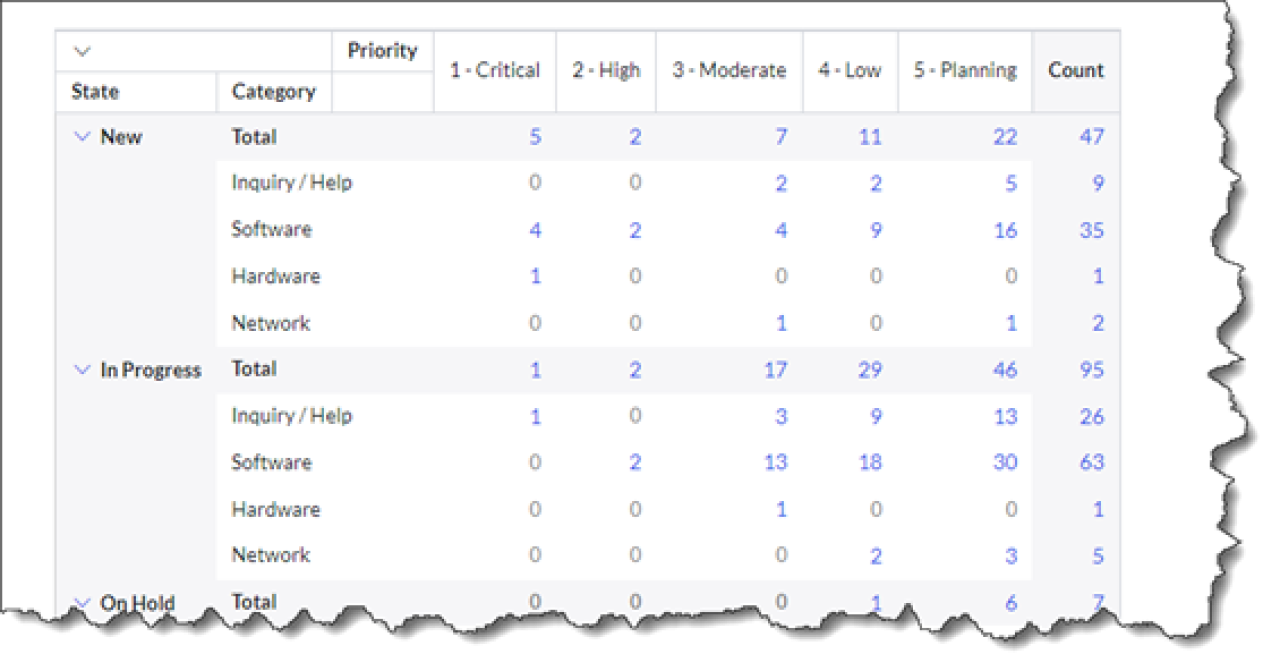
Can ServiceNow create table based reports?

Aside from creating pure list reports of the underpinning data tables, ServiceNow reports have the ability to create pivot and multi-level pivot tables. These essentially allow you to take a single metric and pivot it by one or more fields, similar to what you may produce in Excel. The emphasis here is on a single metric.

Example reporting multi-level pivot report

ServiceNow reports do not currently offer capability to:

  • Create a time series based table such as the one below. Time series reports are limited to graphical charts such as bars and lines only.

  • Create a table with multiple metrics consolidated within it (although there is now a level of functionality available to create multiple aggregated fields within the Next Experience data visualisations).

Metric January 2022 February 2022 March 2022 April 2022
Number of incidents logged 100 180 200 150

Performance Analytics offers enhanced capability in respect of solving the ability to display multiple KPI’s concurrently as well as comparing to different time periods. Performance Analytics scorecard visualisations enable you to add multiple indicators to a single widget and configure the number of periods that are shown to create a table such as the one below.

PA scorecard visualisations displaying multiple indicator results over time

If you're looking to achieve higher levels of customisation - where perhaps you'd like to customise the columns or add more groupings - this is currently beyond the offerings of Performance Analytics as it stands today.

When discussing table reporting requirements, these typically stem from an underpinning requirement to be able to export these into tools such as Excel. It’s worth mentioning that there is also no current ability to export such Performance Analytics visualisations or export pivot reports to Microsoft Excel.

Can I use ServiceNow for forward looking data?

Some data points within your process will look at future based data, such as projected project closures and scheduled changes, so naturally you’ll be wanting to report on such data types. 

The reporting functionality in ServiceNow allows you to add filters for future periods. If you want to create a report showing the total expected amount associated to project milestone payment tasks planned for the next six months, you can be reassured that ServiceNow reporting has the capability to add those future date filters.

When looking at Performance Analytics functionality, whilst the product offers forecasting capability, this is based on forecast of actual data only.  Performance Analytics is primarily designed to look at past performance, so of course, trying to utilise the product for data that is aligned to dates and times in the future gets quite tricky. Given that features such as calculating percentages cannot be performed within reporting, finding a solution that bridges the two functionalities can become even more of a challenge.

At Unifii, we’ve become accustomed to implementing a few tricks to work around some of the limitations in Performance Analytics.

There are many other areas of ServiceNow Now Intelligence that we haven’t explored within this article, such as those below:

  • KPI Composer

  • Spotlight

  • In-Form Analytics

  • Platform Analytics

    • Analytics Centre

    • KPI Details

    • KPI Signals

    • Next Experience Dashboards

    • Data Visualisations

We'd highly recommend that you explore these options and stay tuned to our blog posts for future content that discusses these topics.

Here at Unifii, we have a team of experienced individuals that specialise in data analytics and the capabilities/nuances that your organisation may need to navigate through to fully recognise your business intelligence strategy, enable effective operational reporting, achieve continual service improvement and meet the needs of contractual, audit or other governance bodies.


Our team would love to talk to you and hear about any challenges that you’re having. Whether you’re exploring ServiceNow for the first time, or have been using it for a while with some specific KPI’s that you haven’t been able to nail (yet), we can help. Get in touch today here.

Share


Written by

Mike Turner

Analytics Lead (Principal Consultant)

See the possibilities with Unifii by exploring your own demo

Helping clients align their technology with their business goals and deliver the tools and processes needed to support their businesses.
Book a strategy session