Reporting vs Performance Analytics: What's the Difference? Part Two
Updated: 18th Oct, 2022
Welcome back to our Reporting vs Performance Analytics: What’s the Difference? series! Through several explanatory articles, we help you understand the often confusing topic of ServiceNow reporting and how it weighs up against the Performance Analytics application. We’ll be going through the differences between them both, helping you understand whether your organisation would benefit from Performance Analytics.
In Part One, we talked about the capabilities that standard reporting within ServiceNow offers and the types of calculations achievable, and how exactly Performance Analytics differs to this. While we took a surface level look at PA, we’ll be dissecting this in more detail in the upcoming content. If you haven't read Part One, check it out here.
Leading on to Part Two, we’ll be going through Analytics Hub (what it is and how it comes into this topic) and our recommendations for pre-requisite data calculations and their importance.
As a reminder...
The main takeaway from Part One is that Performance Analytics is not a premium version of ServiceNow reporting. SN reporting has an extensive range of reporting capabilities, with a highly comprehensive range of visual charts to display your data. It also allows for time series trending to be achieved. Basic calculations are also possible, but more complex ones (e.g. dividing two aggregated numbers by one another) are not. Ultimately, PA and reporting are separate capabilities with their own distinct benefits.
What's Analytics Hub about? How is it important?
Analytics Hub is an exploratory view of indicators used for detailed analysis. It lets you see trends, predictions, breakdowns and associated records for a specific indicator – and this is where the real power is unleashed.
This capability allows a user to open a single indicator and carry out detailed analysis, with the ability to:
Dynamically control the aggregation applied
Change the timespan
View the results over time and add trend lines
Interrogate the results for specific breakdowns
Set global and individual targets and track performance against them
Add comments against data points to help explain patterns
Forecast future results based on past performance
…and more.
By default, any Performance Analytics widget on a responsive dashboard will take the user to the Analytics Hub view when drilled down upon.
Analytics Hub example
So in a nutshell, is Performance Analytics where I go to create ANY advanced calculation?
Woah woah – not so fast! It’s common for people to jump to the conclusion that Performance Analytics is required for any type of calculation. We too often hear the comment, “You need Performance Analytics for that!”
It’s critical to remember that PA should never become the master definition of data.
What do we mean by this? Well, we talked about how PA can create formulas such as “percentage of changes closed successfully.” This type of formula is absolutely the right fit for PA – after all, we can clearly identify the existing data to understand which changes were closed and when, and whether they were closed successfully (assuming the close code data quality is reliable).
So how about asking PA to calculate the percentage of incidents that were resolved in eight hours? If we’re literally talking about taking the duration field of an incident and filtering on it, then this isn’t a problem: the data is available and transparent. However, it’s likely that your eight-hour target is eight business hours (perhaps Monday-Friday 9-5pm excluding Bank Holidays), and you want to pause the clock every time the incident is put on hold. Sound familiar?
This is a perfect illustration of how SLA (Service Level Agreement) definitions are required to be configured as a pre-requisite to reporting or PA. With SLA definitions configured, separate SLA records will be generated and the required calculations performed. Based on this new data, we can then assess whether reporting can be used to create desired results (total records, total passes, total breaches), or if Performance Analytics is required (percentage of records met target).
So that’s all well and good, but what about if you want to calculate something like “average length of employment service” based on my HR user records? We have the employment start and end date in our user data, so can you create a PA indicator for this?
We could, but we wouldn’t recommend it without another step in between. If we were to create a scripted PA indicator that assesses each employee and calculates their length of service, PA would spit out an average, meeting the requirement precisely…BUT we would lose the transparency.
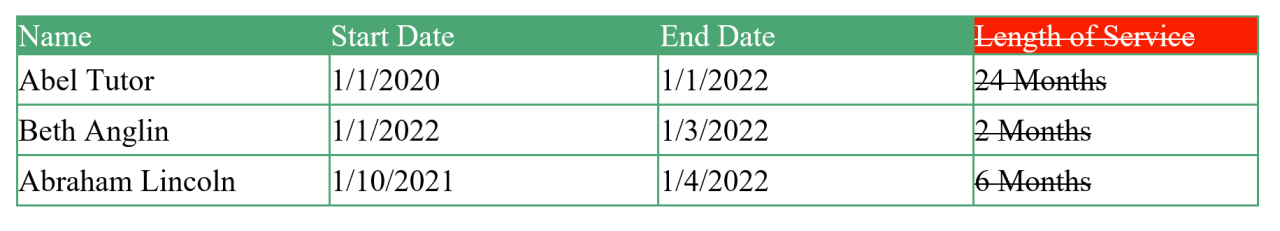
With any result, we’d recommend that a user should have the ability to click any number and drill down to the data behind it. In this use case, we’d expect there to be a table including the user data that shows each employees’ length of service.
Data transparency example
If we left this calculation to PA alone, this level of transparency would not be provided when drilling down, and the user would be left with seeing the start and end date but not the duration on a per record basis. We recommend that pre-requisite steps are always taken to ensure that this level of data transparency can be enabled, and to then use this datasource for reporting.
Whilst we always encourage our customers to align as closely to out-of-the-box as possible and avoid customisations, reporting fields are an area of exception to this. Bear in mind the obvious caveat that you still need to be sensible and add fields that will drive value for reporting enablement. Ideally, don’t just add fields for every calculation that you can possibly think of just in case someone, somewhere, someday may want to see it.
As you can see, it’s important not to jump the gun and assume that Performance Analytics is a magic bullet to singularly solve all complex requirements. You may still require additional prerequisite data steps which could even result in you being able to create some of your reports without PA at all. This is extremely useful to know if you don’t have PA entitlement and were under the impression that a certain KPIS were out of reach without it.
Recommendations for pre-requisite data calculations
Utilise the reporting function fields feature to add calculated fields, such as a duration, to your tables. Once created, you can then use them for reporting (and PA) and keep the transparency for audit.
Some advanced calculations or ServiceNow functions might not be possible through function fields, so you may require custom fields with associated scripting (business rules) to be created by an admin or developer. In some cases you may even need to look at custom tables.
Some calculations may require the use of Metric Definitions. Metrics typically allow you to track changes to fields and build up data.
And as mentioned, some calculations may require the use of SLA Definitions, especially if they relate directly to your contracts and measure the amount of time that has elapsed between two points with a business schedule involved.
Part Three of our series is all about responsive dashboards - how ServiceNow brings data together in them, different filtering options, and how we recommend working with the current dashboard capabilities. If it’s dashboard related, you name it, we’ve probably covered it. Part Three will also provide insight on whether Performance Analytics is worth you investing in for your business.
To learn more or just have a chat with us around your reporting needs, please reach out to one of the team here.